
This post is the second one in a series of posts discussing hands on experience with the IoT Gateway and the Microsoft Azure IoT Suite. In the previous post, we went through the gateway itself and developed our first IoT workflow using the Node-RED environment installed on the gateway. Everything we did back then was done locally, no cloud involved yet. In this post, we will cover the cloud setup, i.e. the Microsoft Azure IoT Suite. Again, the hands-on-lab from Intel will be used to guide us through the process. Our goal is not to duplicate all the information from the very detailed and well documented tutorial. We just want to show you what to expect, peak your curiosity enough for you to go try it yourself, as well as smooth your experience by incorporating some of the lessons we learned along the way.
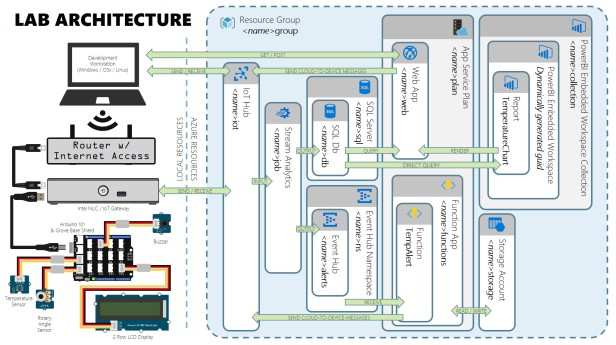
The image above visualizes the complete architecture of the hands-on-lab (original figure: link). The necessary schema’s, source code, … can be found in the following github repository.
Planning the Microsoft Azure resources
The right side of the figure above gives you an overview of all the resources required to make our application working the way we want to. Careful planning could possibly save you money as well as make your life a lot easier.
From a very high level the solution we will be developing looks as follows. Our IoT gateway communicates with the Microsoft Azure cloud through the IoT Hub. This is both for sending sensor data to the cloud as well as receiving commands from the cloud. The IoT Hub will forward the sensor readings to a Stream Analytics Job. This service will monitor all incoming sensor readings and on one hand persist them into a SQL database and on the other hand forward them to the Event Hub. There is a Web App that is used to visualize the (most recent) data. There is also a Function App that is used to send alerts back to the IoT Hub (and eventually the gateway).
Creating a Microsoft Azure IoT Hub and a Device Identity
The first two tasks are about setting up the Microsoft Azure IoT Hub. This can be simply done using the Azure Portal, selecting the respective service and filling-in the blanks. One additional thing to do is to create a consumer group which, at a later stage, will be used by the Stream Analytics Job, an instrumented piece of code that specifies data streams to abserve, transform, inspect and what actions to undertake when conditions apply. Each application that will read from your IoT Hub should get its own consumer group, a private state view on the hub. If you are sure there will be only one, you could get away with just using the default one.
For our gateway to send and receive messages from the IoT Hub, it needs to be registered as a device. This is where things have become easier now. A Device Explorer has been added to the Azure Portal. This explorer allows us to create the device identity of the gateway. Something which before was only possible through a graphical tool on Windows or through the iothub-explorer using a terminal.
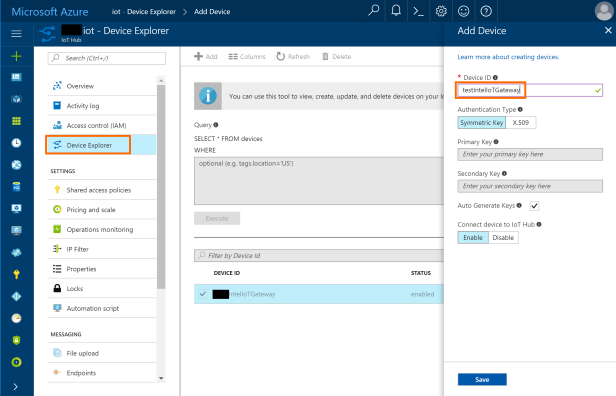
Just click Device Explorer > Add. Fill in a unique ID for your device and save the settings (see figure above). The connection string for this device can then be retrieved from the device’s details blade. This string is needed in your IoT workflow later.
Publishing Sensor Data to the Microsoft Azure IoT Hub
With the Azure IoT Hub set up, we now can start to publishing the sensor data to the Cloud. To do this, additional software packages need to be installed onto the Intel IoT gateway. In the hands-on-lab, several commands are executed through a secure shell. Note that these steps could also be done using the Cloud command web console as mentioned in our previous post.
A new package is installed to communicate with Microsoft Azure Services. This installs the azure CLI and IoT SDKs for C, Python, and Java. On top of that, a new node in the Intel Gateway hosted Node-RED environment is made available that allows to send messages to the IoT Hub. The only thing that needs to be configured in our Node-RED flow is the connection string for the IoT Hub in the azureiothub node, and more particularly, the device we create in the previous step above.
Processing Sensor Data with Stream Analytics
With our data now streaming from our sensors across the gateway to the Azure Cloud, processing the data stream is done using a Stream Analytics job. This is a continuously running service that takes the output of the IoT Hub as input, performs some queries on this data, and has an SQL Database and an Event Hub as output. In order not having to jump back and forth, the outputs are created first. After both services have been setup, we just need to wire them together. Select the inputs and output and build a query in between. The query is in fact two queries, one to select all the incoming data and put it in the database and another one to only filter readings above a threshold and put those into the event hub.
Displaying Sensor Data with Microsoft Web Apps
The next task is about setting up a Web App in Microsoft Azure (as you probably have done many times before). The source code for the web app is provided and can be found inside a github repository. All you need to do is modify the configuration for your SQL database and the IoT Hub. The web app is a single page app refreshing every 30 seconds and displaying the most recent values from the database on the screen. The app experience is not very fluid due to the automatic refresh interval but it gives you a first idea.
Sending messages from the Microsoft IoT Hub to the Intel IoT Gateway
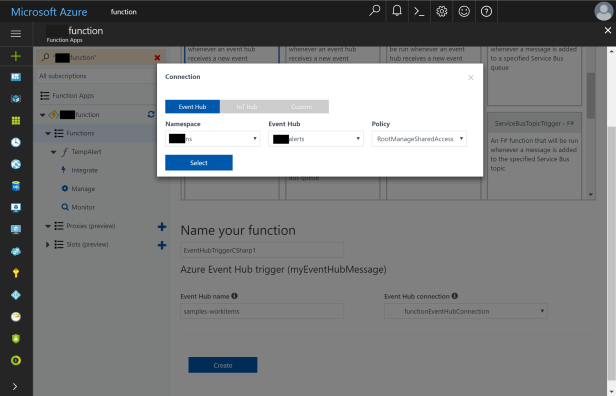
As mentioned in the beginning. The IoT Hus is also used to send commands back to our gateway. This can be done in two ways. The first, as you might have noticed when completing the task before this one, is to use the test button on the web page to trigger the buzzer in our demo setup. The second is using a so-called Function App. Function Apps are Microsoft’s take on the ‘serverless computing model’, which you might know from Amazon’s Lambda. It allows us to specify a small piece of code which is executed upon a certain trigger. In our case, the Event Hub is our trigger, meaning all alerts (temperature data above our threshold), are triggering our source code. When setting up the Azure Event Hub trigger in the Azure Function, one can now simply select the correct Event Hub to connect to instead of manually having to enter the connection string for the Services Bus (see figure below). Alternatively, you can select an IoT Hub directly, or using a good old connection string directly.
You can also find the source code to be used in the github repository of the hands-on-lab.
Display Sensor Data with Power BI (Embedded)
The final (optional) task is about visualizing our sensor data, inside the Web App we created before, using Power BI. It refers to this section in the lab. Due to some changes in Azure this section could not be completed as described. At least not on our side at the time of writing. What follows are the steps we took to achieve the same outcome.
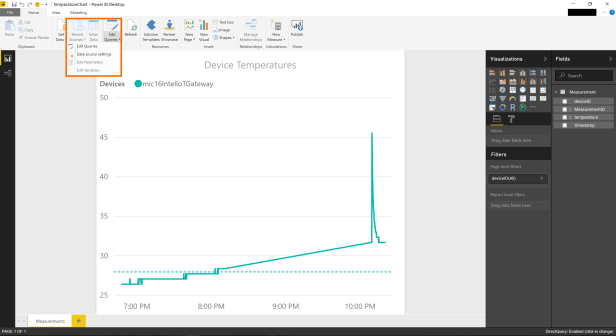
Note that the following steps are performed in Power BI desktop. First, download and open the TemperatureChart.pbix (link). At the moment, this chart connects to the source used in the lab, so we need to change that. Click Edit Queries > Data Source settings (see figure below).
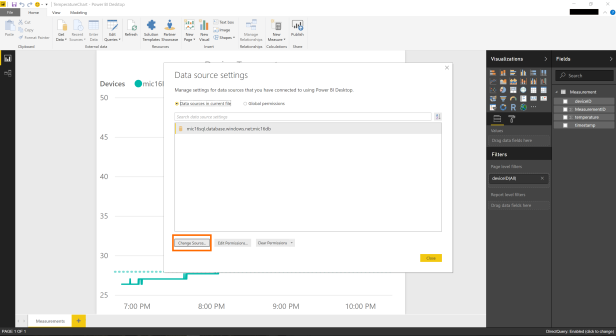
A dialog window opens where you can manage the data sources. Click Change Source (see figure below). Another dialog window pops up where you need to enter your SQL server and database. Click Ok, and then click Close.
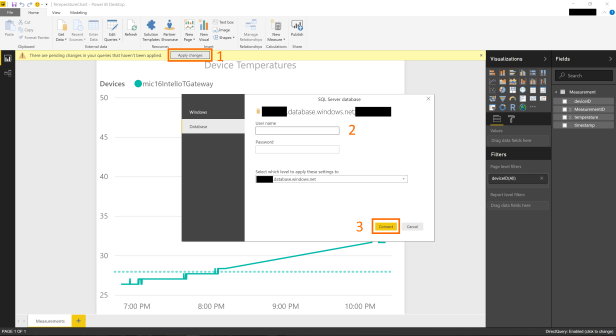
A small notification pops up that allows you to apply the changes just made (see figure below). Click Apply changes (1). A dialog window pops up where you need to specify your credentials for the data source you just entered (2). Click Connect and you are all set (3). You should see your data be shown in the chart now.
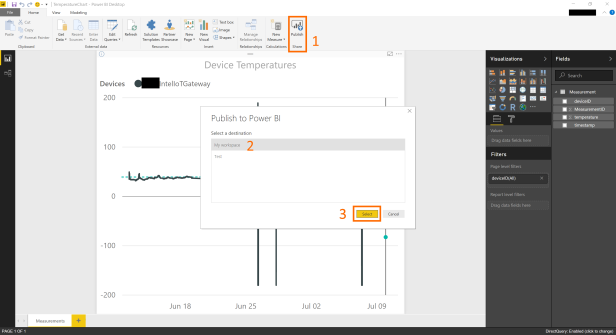
For us to embed the chart into our Web App, we need to publish it to Power BI on the web (see figure below). Click Publish (1). Select a destination (2) and click Select (3).
If you now sign in to your online Power BI environment, you should see the Temperature chart appear (see figure below).
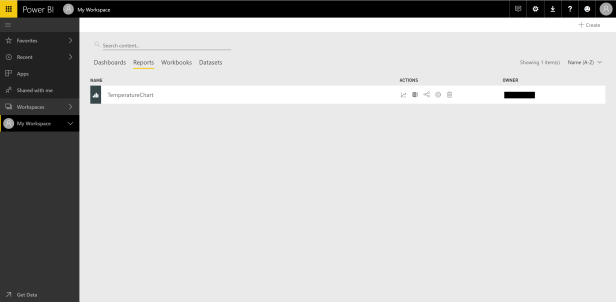
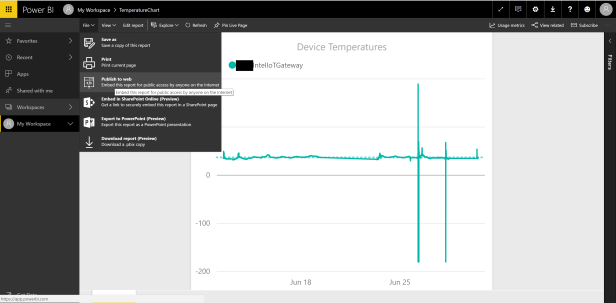
Click the TemperatureChart report. You should now see the same data appear as you did in the desktop version of Power BI. Click File > Publish to web. A dialog window pops up that provides you with a snippet of HTML code we can use to embed the report into our Web App.
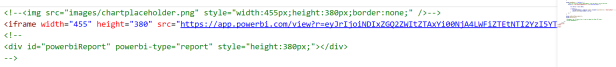
Next, you to the Web App and open index.html. Comment out the image placeholder for the chart and place the HTML code snippet into the file and you are done (see figure below).
Launching the Web App should now show you a nice Power BI chart embedded into your app.
Conclusion
That’s all for now. In this blog post and also the previous we have covered the Intel IoT Gateway and the Microsoft Azure IoT Suite using a hands-on-lab provided by Intel. Initial experience with the gateway was fulfilling. It for the most part just worked out of the box. Something which is often not the case. Overall, a rather complete gateway worth investigating further.

Bram Pellens
Senior Researcher @ Spikes
![]()
![]()
