

Ever wanted to show a nice colored figure based on a calculated field in a SharePoint list without programming because you can’t 😉 ?
This is the example :
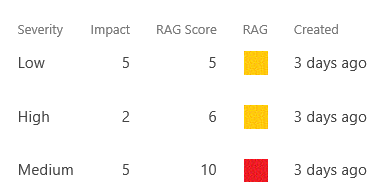
I have a Column for “Severity” and one for “Impact”.
The column RAG score is a simple calculated field.
Now i wanted the RAG field that would represent the RAG score in a visual way like showed in the figure below :
How to do it
You create a field “RAG” that will show the figure as a surprise !!!! NUMERIC FIELD.
Within the formule of that field you put the following :

Some explanation :
the command : <DIV><img src= will tell SharePoint to in fact enable the “numeric” field to contain a picture.
Obviously the “/sites/projects/siteAssets/rood.gif” refers to the icons you created an placed in a central location. Make sure that the users have read access to the picture list.
then using the IF command you define the formula which decides on the color you want for which value. in this example I wanted :
GREEN for values lower than 4
ORANGE for values between 4 and 9
RED for values higher than 9
That’s it.
–

Tom Jacobs
Senior Business Productivity Consultant @ Spikes
![]()
![]()
–
